HTML5中的Canvas(绘制)
时间:11-17来源:作者:点击数:
Canvas中不仅可以画线(路径),还能画很多其他的图像,这一章就介绍Canvas的其他两种绘图API。
矩形
我们在上一章只用线来画了一个矩形,其实可以一下子就画出来的,用下面函数:
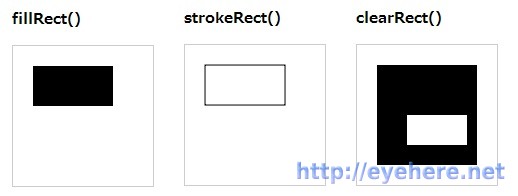
- ctx.fillRect(x, y, width, height)
画一个填充的矩形,x, y是矩形左上坐标,剩余两个不是右下坐标而是宽度和高度。 - ctx.strokeRect(x, y, width, height)
类似的,不过只画线不填充。 - ctx.clearRect(x, y, width, height)
把指定的区域删除。
我们先准备三个Canvas,(html代码如下):
<h2>fillRect()</h2>
<canvas id="c1" width="140" height="140"></canvas>
<h2>strokeRect()</h2>
<canvas id="c2" width="140" height="140"></canvas>
<h2>clearRect()</h2>
<canvas id="c3" width="140" height="140"></canvas>
然后是我们的绘图参数:
onload = function() {
  draw1();
  draw2();
  draw3();
};
/* fillRect() */
function draw1() {
  var canvas = document.getElementById('c1');
  if ( ! canvas || ! canvas.getContext ) { return false; }
  var ctx = canvas.getContext('2d');
  ctx.beginPath();
  ctx.fillRect(20, 20, 80, 40);
}
/* strokeRect() */
function draw2() {
  var canvas = document.getElementById('c2');
  if ( ! canvas || ! canvas.getContext ) { return false; }
  var ctx = canvas.getContext('2d');
  ctx.beginPath();
  ctx.strokeRect(20, 20, 80, 40);
}
/* clearRect() */
function draw3() {
  var canvas = document.getElementById('c3');
  if ( ! canvas || ! canvas.getContext ) { return false; }
  var ctx = canvas.getContext('2d');
  ctx.beginPath();
  ctx.fillRect(20, 20, 100, 100);
  ctx.beginPath();
  ctx.clearRect(50, 70, 60, 30);
}
结果如下图所示,就不提供实际的演示文件了,请自己输入确认。
上一次我们使用线绘的时候,还是用了fill和stroke方法,现在是不需要的。
圆(弧)
先看一下参数:
- ctx.arc(x, y, radius, startAngle, endAngle, anticlockwise)
画圆或者圆弧。x,y为圆心坐标,radius为半径,startAngle,endAngle为开始/结束划圆的角度,anticlockwise为是否逆时针画圆(True为逆时针,False为顺时针)。
注意这里的角度为弧度制,所以如果画一个正圆的话,是0 -> Math.PI * 2,而画60°的话,就是0 -> 60 * Math.PI / 180,最过分的是,这个和我们一般几何里的x方向0°,y方向90°反过来了……利用上面的Canvas,再画圆试试:
onload = function() {
  draw1();
  draw2();
  draw3();
};
/* 整个圆 */
function draw1() {
  var canvas = document.getElementById('c1');
  if ( ! canvas || ! canvas.getContext ) { return false; }
  var ctx = canvas.getContext('2d');
  ctx.beginPath();
  ctx.arc(70, 70, 60, 0, Math.PI*2, false);
  ctx.stroke();
}
/* 10° ~ 80°,无填充 */
function draw2() {
  var canvas = document.getElementById('c2');
  if ( ! canvas || ! canvas.getContext ) { return false; }
  var ctx = canvas.getContext('2d');
  ctx.beginPath();
  ctx.arc(70, 70, 60, 10 * Math.PI / 180, 80 * Math.PI / 180, true);
  ctx.stroke();
}
/* 10° ~ 80°,填充 */
function draw3() {
  var canvas = document.getElementById('c3');
  if ( ! canvas || ! canvas.getContext ) { return false; }
  var ctx = canvas.getContext('2d');
  ctx.beginPath();
  ctx.arc(70, 70, 60, 10 * Math.PI / 180, 80 * Math.PI / 180, true);
  ctx.fill();
}
结果如下图的上三个情况,也请自己输入加深印象。
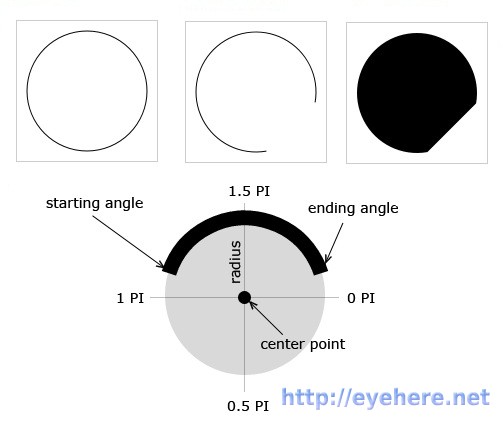
下图为startAngle=1.1PI,endAngle=1.9PI,anticlockwise为false的情况下的绘制情况,注意从x轴方向开始,往下走角度开始。
这个方法便需要用户手动调用fill或stroke方法(为什么如此不统一……)。
方便获取更多学习、工作、生活信息请关注本站微信公众号


上一篇:HTML5中的Canvas(使用)
下一篇:HTML5中的Canvas(颜色)


 湘公网安备 43102202000103号